1 The standard value of financial data in comparison of 9 individual indicators among the top 10
competitiveness enterprises in the wire and cable industry of China
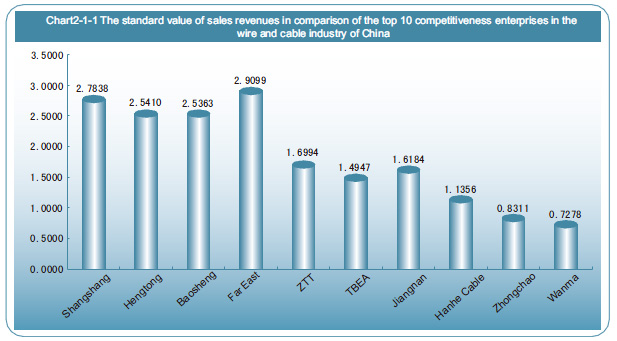
Chart 4-2-1 The standard value of sales revenues in comparison of the top 10 competitiveness enterprises in the wire and
cable
industry of China
Chart 4-2-2 The standard value of net assets in comparison of the top 10 competitiveness enterprises in the wire and cable
industry of China
Chart 4-2-3 The standard value of net profit in comparison of the top 10 competitiveness enterprises in the wire and cable
industry of China
Chart 4-2-4 The standard value of return on total assets in comparison of the top 10 competitiveness enterprises in wire
and cable
industry of China
Chart 4-2-5 The standard value of return on net assets in comparison of the top 10 competitiveness enterprises in the wire
and cable
industry of China
Chart 4-2-6 The standard value of sales revenues contribution per employee in comparison of the top 10 competitiveness
enterprises in the
wire and cable industry of China
Chart 4-2-7 The standard value of ratio of international revenues to total sales revenues in comparison of the top 10
competitiveness
enterprises in the wire and cable industry of China

Chart 4-2-8 The standard value of average growth rate of sales revenues for the last three years in comparison of the top
10
competitiveness enterprises in wire and cable industry of China
Chart 4-2-9 The standard value of average growth rate of net profit for the last three years in comparison of the top 10
competitiveness
enterprises in the wire and cable industry of China
………… 【Please refer to "The competitiveness report on 'the Top 10 competitiveness enterprises in the wire and cable
industry of China during 2013-2014' (integrated edition)" for details】
2 The analysis of the enterprise competitiveness status of the top 10 competitiveness enterprises in the wire
and cable industry
 |
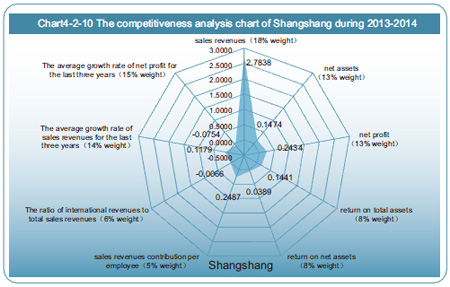
It can be seen from the chart 4-2-10 that Shangshang has an obvious advantage of efficiency sub-factors. Moreover, sales revenues have been growing in step with sales revenues contribution per employee. These demonstrate that Shangshang is capable of the management of maintaining rapid scale expansion. The wire and cable market, where major products of Shangshang enter, becomes increasingly fierce in competition. There has also been a successive increase of the cost of raw materials and relevant auxiliary products. The future growth and expansion rest on whether the company could further strengthen the scale, brand and technological advantages, control costs for raw materials and purchase, optimize the product structure and technological process, and improve the advantages of cost. |
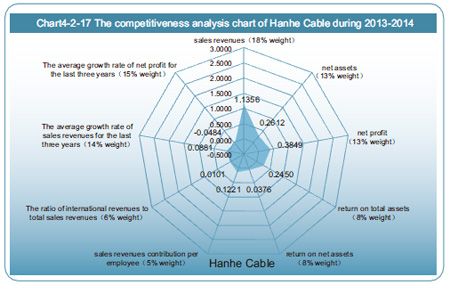
| Chart 4-2-17 reveals that Hanhe Cable is in the industry front row in terms of net assets and net profit and also has a relatively higher rate of return on total assets and return on net assets. Its competitive edge has become more evident in aspect of profitability. The crucial step forward is to enlarge scale. Competitiveness can achieve a greater enhancement, if Hanhe Cable can make breakthroughs in capital operation and scale expansion. |  |
| Chart 4-2-10 The competitiveness analysis chart of Shangshang in 2014 Chart 4-2-11 The competitiveness analysis chart of Hengtong in 2014 Chart 4-2-12 The competitiveness analysis chart of Baosheng in 2014 Chart 4-2-13 The competitiveness analysis chart of Far East in 2014 Chart 4-2-14 The competitiveness analysis chart of ZTT in 2014 Chart 4-2-15 The competitiveness analysis chart of TBEA in 2014 Chart 4-2-16 The competitiveness analysis chart of Jiangnan in 2014 Chart 4-2-17 The competitiveness analysis chart of Hanhe Cable in 2014 Chart 4-2-18 The competitiveness analysis chart of Zhongchao in 2014 Chart 4-2-19 The competitiveness analysis chart of Wanma in 2014 |
|
| ………… 【Please refer to "The competitiveness report on 'the Top 10 competitiveness enterprises in the wire and cable industry of China during 2013-2014' (integrated edition)" for details】 | |
3 The analysis of the strength and weakness of the Top 10 competitiveness enterprises in the wire and cable industry
The financial data of competitiveness is formed by 9 indicators of certain weight, and the strength and weakness indicators are different in each company. We classify the 9 indicators into 2 categories: one is higher than the competitiveness score of the enterprise, that is, these indicators improve the enterprise competitiveness, we call them the strength indicators; otherwise, they are weakness indicators. What the readers should be reminded is that we classify the categories by the standard value of financial data in enterprise competitiveness, but not the average score of the whole industry. For example, Shangshang's standard value of the sales revenues is 0.4862, above the average value, but below the standard value of the enterprise competitiveness, 3.6422, thus we put it into weakness indicators. In the table 4-2-2, the strength indicator is labeled by "↑", and weakness indicator by "↓". With the indicators divided into 2 categories, the enterprises can pay more attention to their weakness ones, which orient their effort to improve their competitiveness. Shangshang, for instance, should be more concerned with increase sub-factors. As for the order of the indicators to draw attention, you can refer to the indicators of the enterprise's specific data to determine.

